Half-Life 2 Lost Coast konnte trotz Zwangsregistrierung überzeugen und ist mit seiner hervorragenden Grafik ein Teil unserer Benchmarks.
(*klick* zum Vergrößern)
Half-Life2 Lost Coast/Max Detail/HDR/16xAF:
| Half-Life2 Lost Coast |
| Sapphire HD3870 X2 CrossfireX | | | HD 2900 XT Crossfire | | | Zotac 9800GX2 | | | XFX 8800 GTX XXX | | | GeCube HD3870 OC Crossfire | | | Jetway HD2900 XT | | | Sapphire HD3870 Atomic | | | Club3D 9600GT | | | PowerColor HD3870 X2 | | |
| | 0 200 100 | FPS |
| |
Tom Clancys Splinter Cell 3 "Chaos Theory“ vom Publisher Ubi Soft setzt zu Teilen auf die zweite Unreal-Grafikengine. Sie unterstützt damit Shader-Model 3.0, High Dynamic Range-Effekte, schönen Schatten sowie Bump Mapping-Effekte.
(*klick* zum Vergrößern)
Splinter Cell 3 - Chaos Theory/High/HDR/16xAF:
| Splinter Cell 3 - Chaos Theory |
| Sapphire HD3870 X2 CrossfireX | | | HD 2900 XT Crossfire | | | GeCube HD3870 OC Crossfire | | | Zotac 9800GX2 | | | PowerColor HD3870 X2 | | | XFX 8800 GTX XXX | | | Jetway HD2900 XT | | | Sapphire HD3870 Atomic | | | Club3D 9600GT | | |
| | 0 300 150 | FPS |
| |
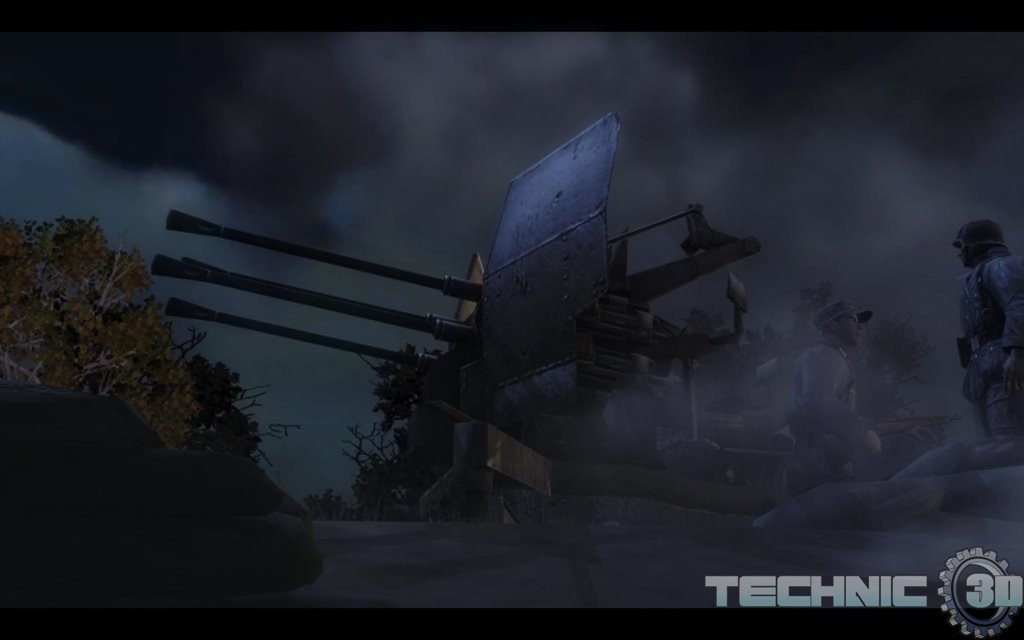
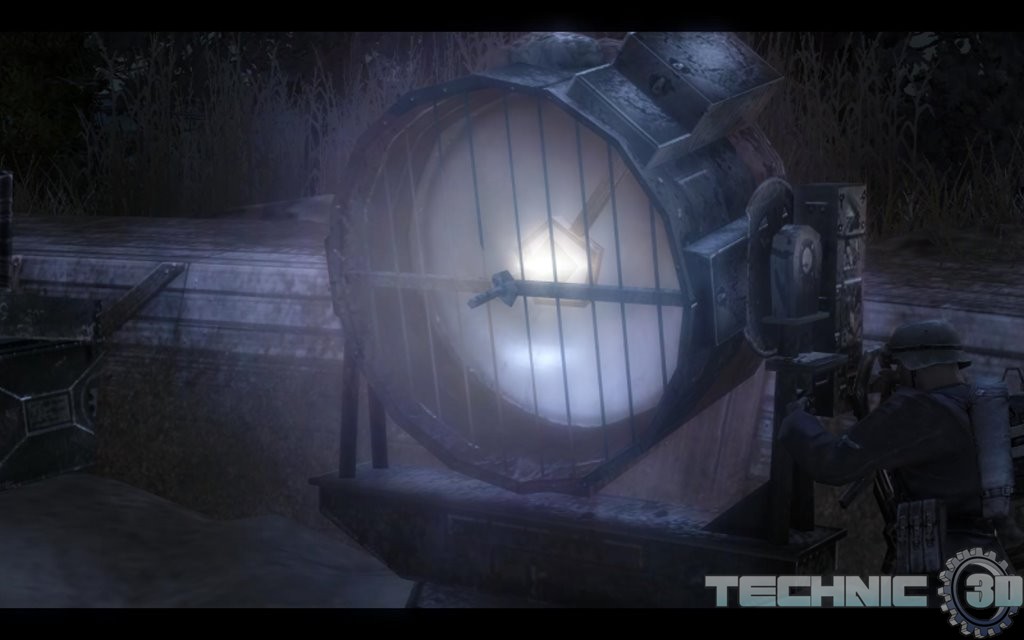
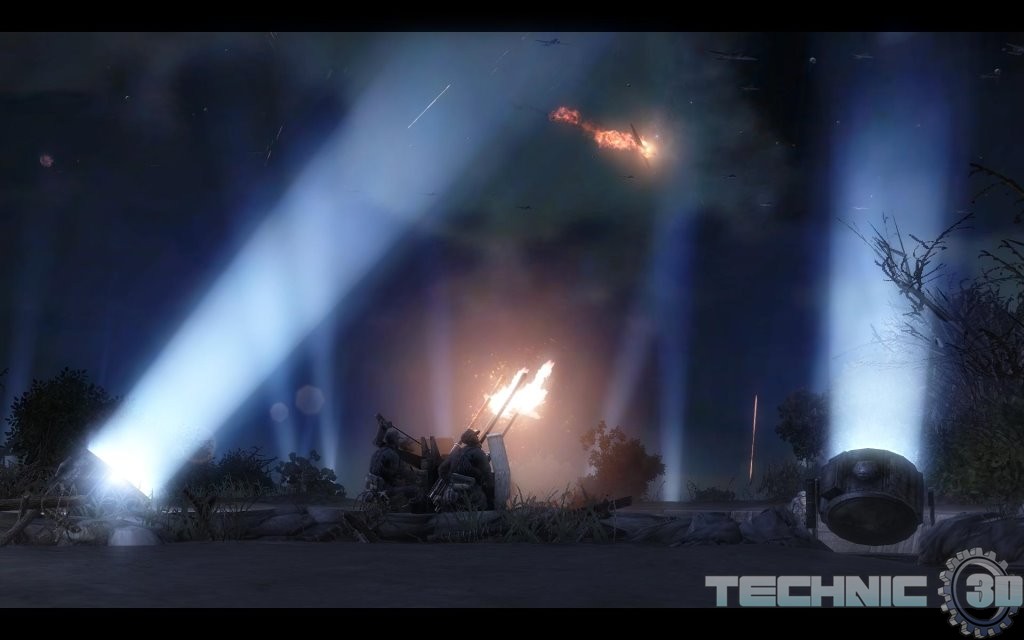
ist mit seiner schicken Grafik ein weiterer Teil unserer Benchmarks.
(*klick* zum Vergrößern)
Company of Heroes/Max Detail:
| Company of Heroes |
| Sapphire HD3870 X2 CrossfireX | | | Zotac 9800GX2 | | | GeCube HD3870 OC Crossfire | | | HD 2900 XT Crossfire | | | PowerColor HD3870 X2 | | | Sapphire HD3870 Atomic | | | XFX 8800 GTX XXX | | | Club3D 9600GT | | |
| | 0 250 125 | FPS |
| |
| Company of Heroes |
| Sapphire HD3870 X2 CrossfireX | | | Zotac 9800GX2 | | | GeCube HD3870 OC Crossfire | | | HD 2900 XT Crossfire | | | PowerColor HD3870 X2 | | | Sapphire HD3870 Atomic | | | XFX 8800 GTX XXX | | | Club3D 9600GT | | | Jetway HD2900 XT | | |
| | 0 250 125 | FPS |
| |