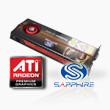
Mit unserem Teststand ist es uns möglich, anstatt vom gesamten Testsystem nur die Leistungsaufnahme der einzelnen Grafikkarte zu messen.
Hierbei liegt die AMD HD5970 Grafikkarte bei rund 41W im Idle unter Windows Vista und 219W im Lastbetrieb bei 3DMark 2006 bzw. 278W bei Furmark. Im 3DMark Vantage werden knapp 224W abgefordert. Die AMD Spezifikationen von 294W werden bei uns nicht erreicht. Unter DirectX 11 sind 276W fällig.
Teststand:
Leistungsaufnahme Sapphire HD5970 OC
| Leistungsaufnahme Sapphire HD5970 OC | ||||||||||||||
| ||||||||||||||
0 300 150 | Watt | |||||||||||||
Leistungsaufnahme Sapphire HD5970 OC 820/2300
| Leistungsaufnahme Sapphire HD5970 OC | ||||
| ||||
0 300 150 | Watt | |||
Leistungsaufnahme bisher getesteter Grafikkarten im Vergleich: Idle Vista/XP
| Vista 32Bit/XP 32 Bit Idle | ||||||||||||||||||||||||||||||||||||||
| ||||||||||||||||||||||||||||||||||||||
0 250 125 | Watt | |||||||||||||||||||||||||||||||||||||
Leistungsaufnahme bisher getesteter Grafikkarten im Vergleich: Vista HD-Filmwiedergabe
- Videocodec: Windows Media Video 9 Professional
(Szene aus Tomb Raider (Lara Croft) 2/ *klick* zum Vergrößern)
| Filmwiedergabe | ||||||||||||||||||||||||||||||||||||||
| ||||||||||||||||||||||||||||||||||||||
0 250 125 | Watt | |||||||||||||||||||||||||||||||||||||
Leistungsaufnahme bisher getesteter Grafikkarten im Vergleich: Last Vista/XP
| Vista 32Bit/XP 32 Bit Last | ||||||||||||||||||||||||||||||||||||||
| ||||||||||||||||||||||||||||||||||||||
0 300 150 | Watt | |||||||||||||||||||||||||||||||||||||


